Hello Everyone,
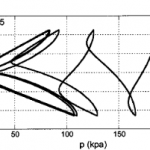
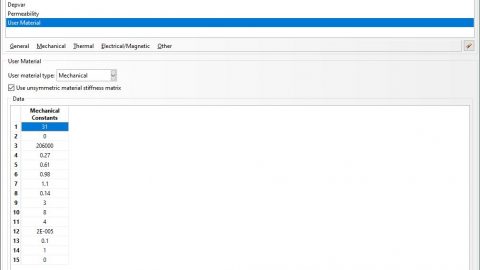
I have been trying to simulate the cyclic triaxial test using the SANISAND04 subroutine. When I plotting the stress path (p-q plot), I am getting only the positive value of q. Maybe because the definition of q i.e; sqrt(J2) always gives a positive value. How to get the negative values of q?. Am I missing something in modeling in Abaqus?. Please help me to figure things out. I have attached the exact figure in which I am getting the values below the p axis.
Thanking you
SAQIB


According to the code qq =statev(31) is always possitive
qq=dsqrt(onept5*trs2)
if you want negative q as well then take q=S11-S33
S11 and S33 is abaqus output include waterpressure assume S33 is vertical
because waterpressure in 1 and 3 is the same it is not in q.
@Arie, Thanks, if we add water pressure it will cancel automatically right ?. i.e: q=(S11-u)-(S33-u). I did the way you suggest but there is not much variation inS11 and S33 which leads to the very small value of q=(S11-S33).
Hello Saqib,
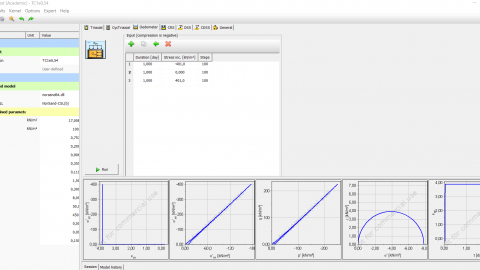
I am also facing the same problem with the negative values of q in the Plaxis Soil Test platform.
Did you manage to solve this issue ?
Looking forward to your response.
Dimitris
Hello Dimitrios.
For getting the negative values of the deviatoric stresses, just product it with the lode angle. You will get the desired results.
Thanks!
Hello again Saqib,
Sorry for the late response. I don’t get notifications from the replies.
So in order to better understand what you say, you are suggesting to:
-Run the cyclic test that i want with the PLAXIS Soil Test platform using the SANISAND dll.
-Get the q-p output from the Soil Test output table.
-Use a routine of my own (Matlab or even excel) to calculate the lode angle for each increment and multiply that to the output q that PLAXIS gave me?
Thanks for your help.
Dimitris